Excel 2010

Variety of payment meansPay orders in convenient ways.
Affordable pricesWe are proud of our prices, hundreds of customers check them every day, which give a choice to our online store!
Description
Download Microsoft Excel 2010, the best data analysis software
Download Microsoft Excel 2010 from our online shop Digitalproductkey. Newer versions of Microsoft Excel are also available on our website such as Microsoft Excel 2019.

Install and activate Microsoft Excel 2010
Download Microsoft Excel 2010 which comes with multiple formulas, charts and tools that you can use for your business analysis reports. The integrated features of Excel 2010 can help you create the best spreadsheets using Sparklines, Slicers, Remove Duplicates and many other tools located on the user interface of Excel 2010. This very commonly used Microsoft Office applications, especially by businesses, is made to help companies and individuals with daily workloads and large data analysis.
Clean data with Remove Duplicate
Install Excel 2010 and enjoy its integrated features such as « Remove Duplicate » which helps users with managing and organizing large data while creating an Excel spreadsheet. This tool is helpful with resolving mistakes such as entering the exact same information twice. Using Remove Duplicate, you will be able to detect duplicate data and instantly remove it. This feature is located on the user interface ribbon by which you can simply clean your data from any duplication.

Pivot Table Slicers
Install Excel 2010 which comes with the Pivot Table Slicers. They consist of visual filters allowing users to detect items displayed within a Pivot Table. Pivot Table Slicers can be customized and you can also connect them to other tables. Additionally, you can filter the Slicers to your needs and create an interactive sales chart. These charts can be used for different subjects while presenting the finished results.

Sparklines for visualization
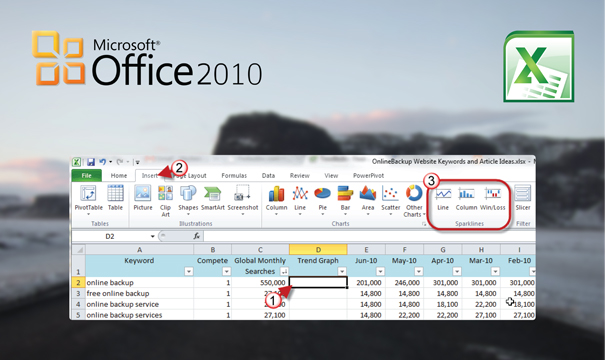
Download Excel 2010 that exclusively comes with the Sparklines feature. This feature consist of charts providing a better visualization of your data. The Sparkline feature also helps you to present your data in a dashboard spreadsheet and shows trends presented in values, such as seasonal value variations and economic cycles. It also highlights maximum and minimum values.


